CRM / What Is Sales Performance Report?
Updated on 06 May, 2024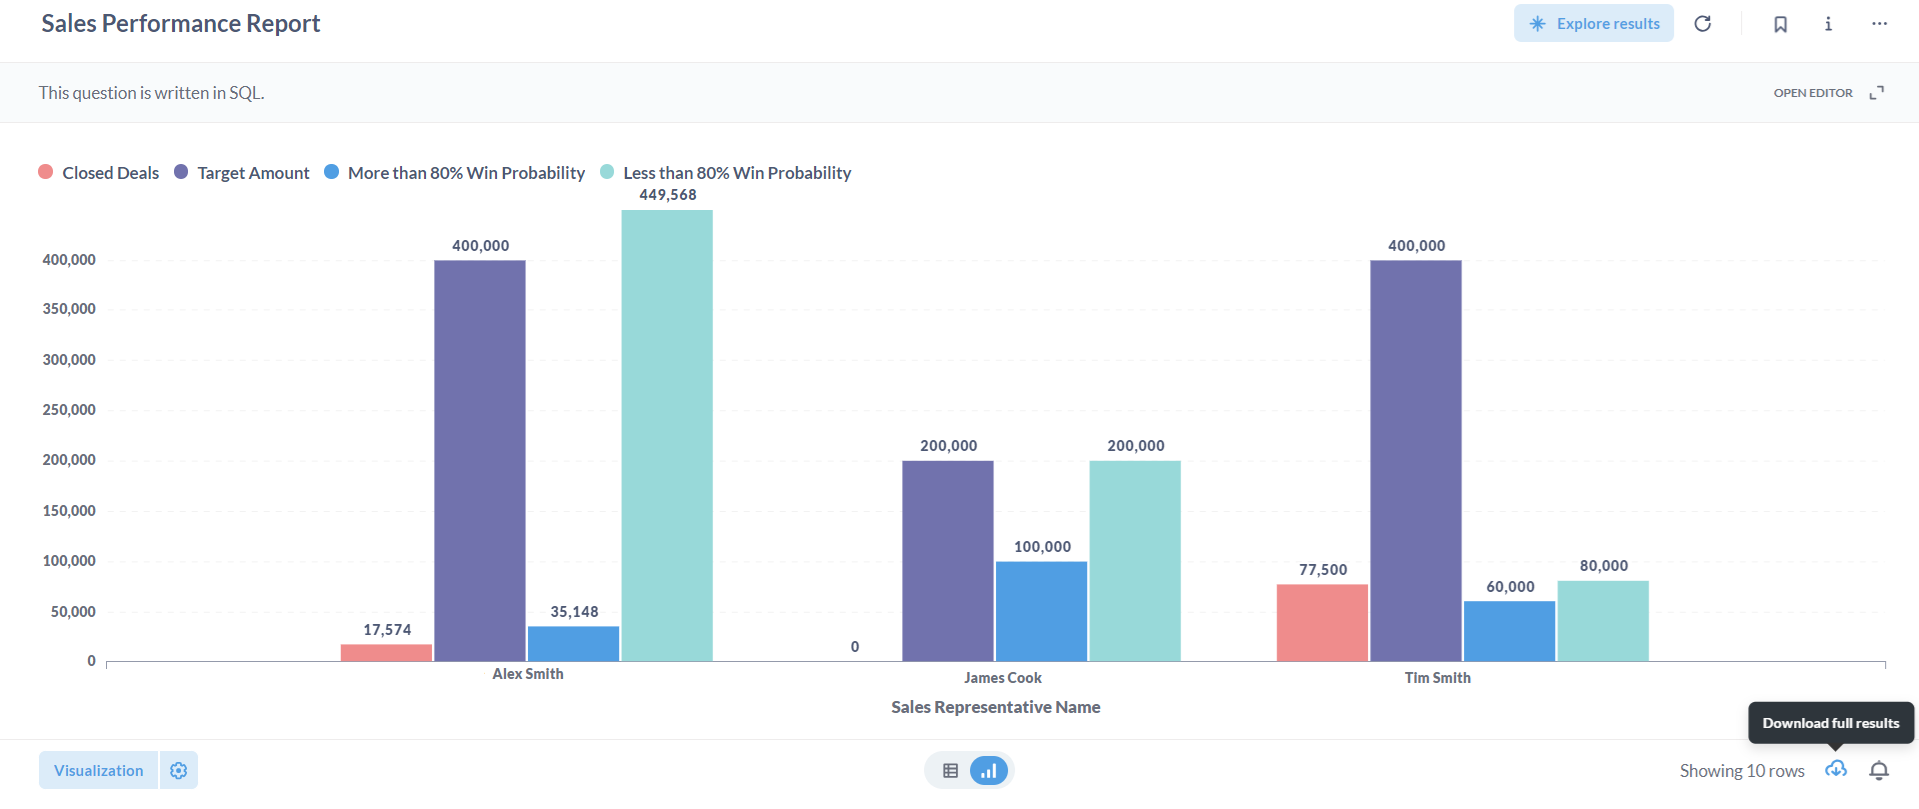
The Sales Performance Report displays the estimates of the actual and expected value of the pipeline deals. Here's our two presenting formats-
1. Graphical Presentation:
This portion of the report provides count of Closed Deals(among the target in numbers), Target Amount(in numbers), More than 80% Win Probability(among the target in numbers), Less than 80% Win Probability(among the target in numbers) for each representative.
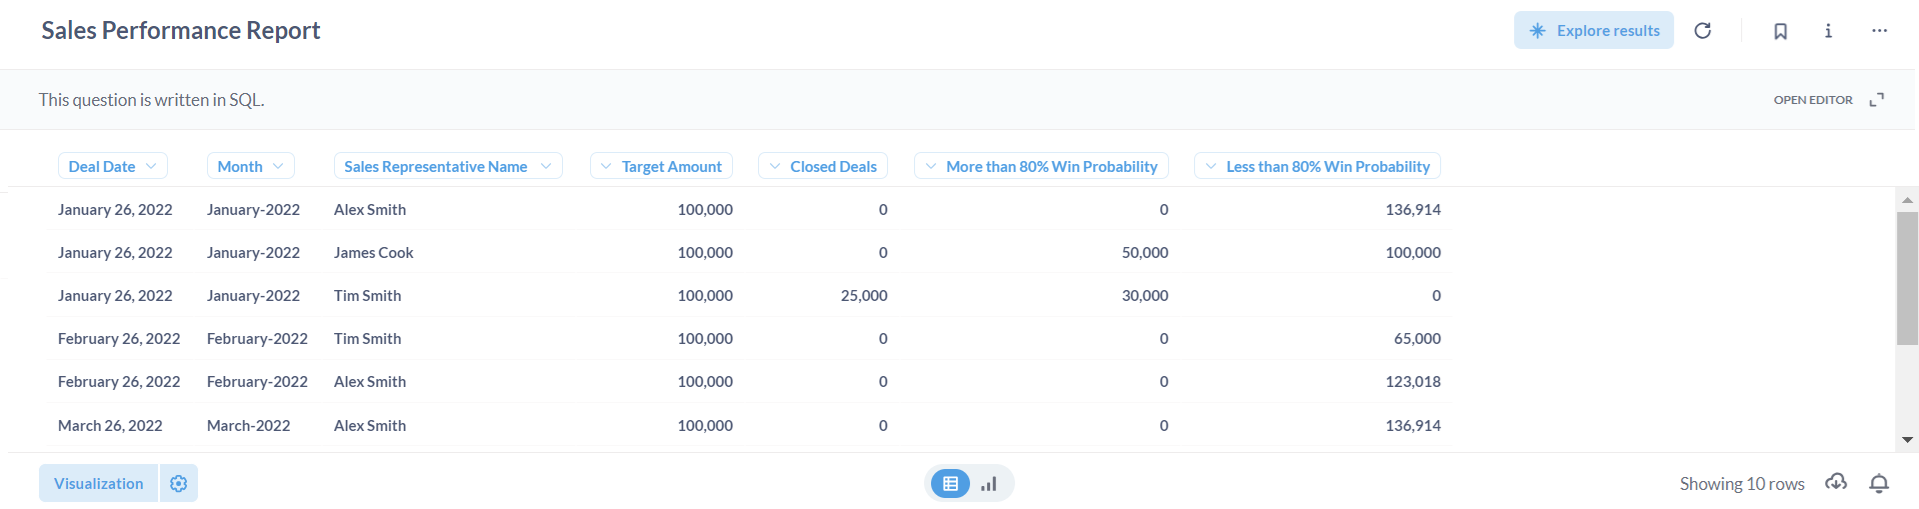
2. Tabular Presentation:
This section displays statistics in a tabular format with a graphical perspective, such as Deal Date, Month, Sales Representative Name, Target Amount(in numbers), Closed Deals(among the target in numbers), More than 80% Win Probability(among the target in numbers), Less than 80% Win Probability(among the target in numbers) and Owner ID.
If necessary, each presentation can be exported in various formats including .csv, .xlsx, .json, and .png by utilizing the Download full results button. This functionality enables users to access and utilize the data in their preferred format for further analysis or documentation purposes.
Did this article help?